Flight Emissions Calculator: Flying vs Driving Home for the Holidays
Last November I booked four flights from New York to Chicago for Thanksgiving, then spent the whole evening arguing with myself about whether we should have just driven. Flying felt like the guilty option. Driving felt like the virtuous one. Neither feeling was based on a single number.
So I ran the numbers with a flight emissions calculator, and the answer surprised me twice. First, the flight was a lot worse than I'd assumed once I counted contrails. Second, the car was only a clear winner because we were four people in it. If I'd been going alone, the two options would have been nearly tied.
This guide is for anyone deciding how to get home this holiday season. By the end you'll be able to estimate the CO₂ for any flight, compare it fairly against driving, and know which variables actually move the answer.

How Do You Calculate Flight Emissions?
A flight emissions calculator estimates the greenhouse gases produced by one flight by multiplying the distance flown by a per-kilometre emission factor, a cabin-class weighting and a multiplier for non-CO₂ warming. It gives you a per-passenger figure in kilograms of CO₂-equivalent (CO₂e), which you can compare against driving or offset.
The method follows the distance-banded approach published by the UK Department for Environment, Food & Rural Affairs (DEFRA). Here is the formula, in plain terms:
The emission factor depends on how far you fly, because take-off and climb burn disproportionately more fuel per kilometre than cruising:
| Flight distance | Factor (kg CO₂ per km) | Type |
|---|---|---|
| Under 1,500 km (930 mi) | 0.255 | Domestic / short-haul |
| 1,500–3,700 km | 0.156 | Medium-haul |
| Over 3,700 km (2,300 mi) | 0.148 | Long-haul |
The 1.9 at the end is the radiative forcing index (RFI). It accounts for contrails, nitrogen oxides and induced cirrus cloud, which a 2021 study by Lee et al. in Atmospheric Environment found roughly double aviation's total warming effect compared with CO₂ alone. Aviation produces about 2.5% of global CO₂ emissions, but its full climate impact is estimated at two to three times that share.
⚠️ Note
Every number in this article is an estimate. Real emissions vary with aircraft type, how full the plane is and the route actually flown. Use the results for comparing options, not as an audited carbon account.
Flying vs Driving: The Thanksgiving Test
Here is my own trip, with the maths shown. New York to Chicago is about 1,150 km (715 miles) by air, and about 1,270 km (790 miles) by road. We were four people travelling round trip.
Flying, economy, per person:
- Distance: 1,150 km × 2 = 2,300 km
- Factor: 0.255 (short-haul band)
- CO₂ only: 2,300 × 0.255 = 586 kg
- With contrails and other effects (× 1.9): 1,114 kg
For four of us, that is 2,346 kg of CO₂ before the RFI uplift, or about 4,460 kg with it.
Driving, whole car:
- Distance: 790 mi × 2 = 1,580 mi
- The US EPA's average for a passenger vehicle is roughly 404 grams of CO₂ per mile
- 1,580 × 0.404 = 638 kg for the entire car, or about 160 kg per person with four on board
| Scenario | Total CO₂ | Per person |
|---|---|---|
| Fly, four people (CO₂ only) | 2,346 kg | 586 kg |
| Fly, four people (with RFI) | 4,457 kg | 1,114 kg |
| Drive, four in one car | 638 kg | 160 kg |
| Drive, solo | 638 kg | 638 kg |

The takeaway is that a car's emissions are shared and a plane seat's are not. A solo driver in an average petrol car emits about the same CO₂ as a single economy passenger on a short domestic flight, 638 kg against 586 kg. Add one passenger and driving pulls well ahead. Add three and it is not close.
Key Takeaway
For trips under roughly 1,500 km, the number of people in the car decides the contest. Driving alone is roughly a tie with flying on CO₂ alone. Driving with two or more people almost always wins.
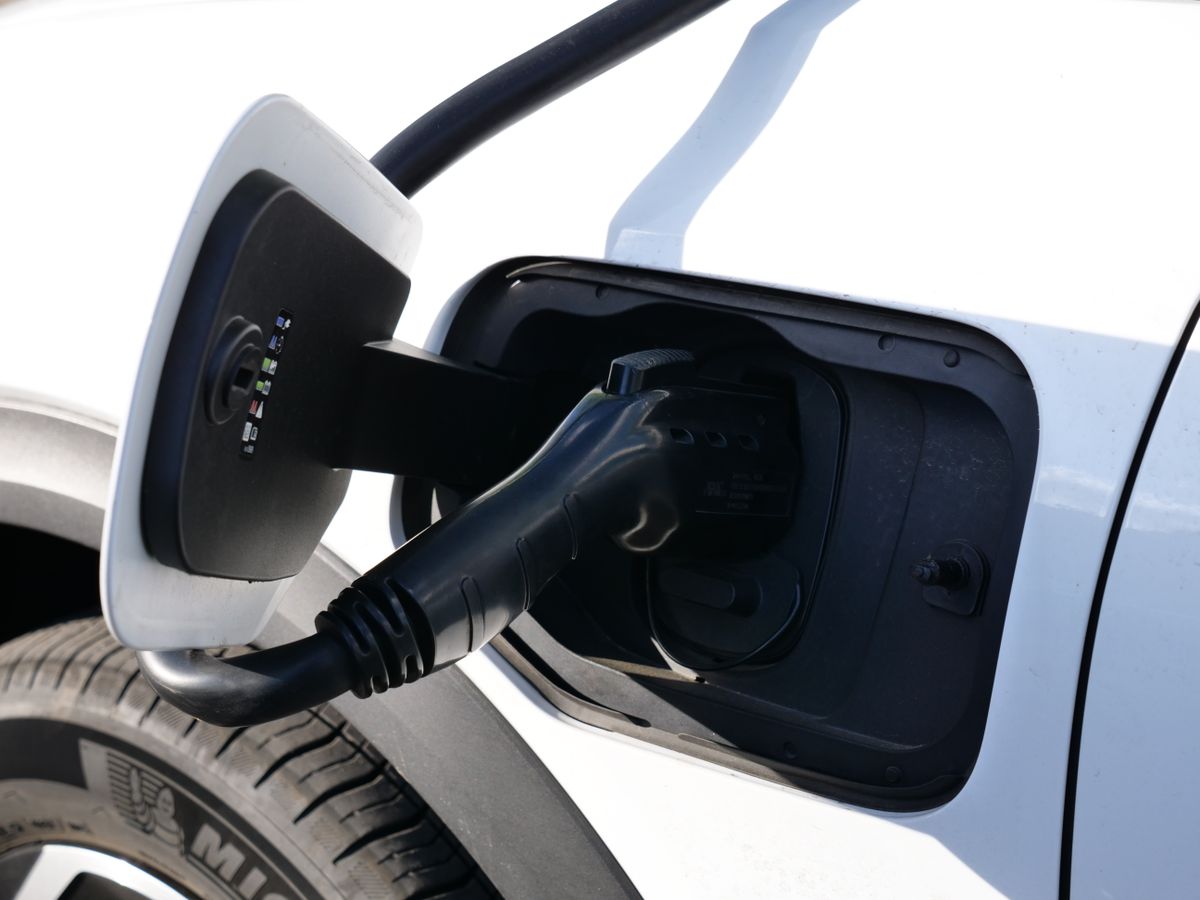
If you drive an electric car the picture changes again. Charging at home can cut the per-mile figure dramatically, and our EV Charging Cost Calculator shows what that trip would cost you in electricity. For a petrol or diesel car, the Fuel Cost Calculator and Fuel Economy Converter help you work out the true cost per mile, which also matters for the wallet side of the decision.
Why Short Flights Punch Above Their Weight
Intuition says longer flights are worse, and in total kilograms they are. But per kilometre, short hops are the least efficient flights you can take. A flight under 1,500 km uses a factor of 0.255 kg per km, about 72% higher than the 0.148 for long-haul.
Here are a few short routes people commonly fly, shown for an economy round trip, per person:
| Route | One-way | CO₂ only | With RFI (×1.9) |
|---|---|---|---|
| London → Edinburgh | 535 km | 273 kg | 518 kg |
| Sydney → Melbourne | 705 km | 360 kg | 683 kg |
| New York → Chicago | 1,150 km | 586 kg | 1,114 kg |
| Los Angeles → Seattle | 1,540 km | 480 kg | 913 kg |
Notice that Los Angeles to Seattle has a lower total than New York to Chicago despite being further. It crosses the 1,500 km threshold and drops to the 0.156 band. That is a quirk of banded factors rather than physics, and it is a good reminder that the calculator is an estimate.

The practical point: if a train or coach exists for a route under 800 km, it is almost always the lowest-carbon choice. Where you must fly, a single non-stop flight beats a connection, because a second take-off adds another fuel-heavy climb.
You can test any route yourself with the Flight Emissions Calculator. Enter the one-way distance in km or miles, tick round trip, and set the passenger count.
What Does Cabin Class Change?
Cabin class weighting is the idea that a premium seat is responsible for a larger share of the plane's fuel burn because it occupies more floor space, so fewer passengers divide the same total emissions.
The multipliers used by the calculator are:
| Cabin | Multiplier | NYC → Chicago round trip (CO₂ only) |
|---|---|---|
| Economy | 1.0× | 586 kg |
| Premium economy | 1.6× | 938 kg |
| Business | 2.9× | 1,701 kg |
| First | 4.0× | 2,346 kg |
A first-class round trip to Chicago produces as much CO₂ as four economy passengers. If you can only change one thing about a flight you've already decided to take, the cabin you sit in is the biggest lever you have.
💡 Pro Tip
Booking the whole holiday trip in one go? Run the numbers for the whole group before you buy. Seeing "4,457 kg" for the family makes the economy-versus-premium decision, and the fly-versus-drive decision, feel very different from seeing a per-seat figure.
Is Carbon Offsetting Worth It?
Offsets are cheaper than most people expect, but their quality varies enormously. Voluntary carbon market prices for credible projects have typically ranged from about US$15 to US$40 per tonne of CO₂.
For our Chicago flight at 1,114 kg per person (1.114 tonnes):
- Low estimate: 1.114 × $15 = about US$17 per person
- High estimate: 1.114 × $40 = about US$45 per person
- Trees needed to absorb the same amount: 1,114 ÷ 21 kg per tree per year, so roughly 53 mature trees working for a full year
That tree figure is the more sobering one. It is a good way to feel the scale, even if buying offsets is a sensible step for flights you can't avoid. Look for projects verified by an independent standard, and treat offsetting as a last step after reducing, not a licence to ignore the first step.
To see how flying fits into your whole year, including home energy and diet, try the Carbon Footprint Calculator. In my own case, as covered in our carbon footprint breakdown, flying wasn't the largest slice.
⚠️ Disclaimer
This article is for informational purposes only and does not constitute environmental, financial or travel advice. Emission figures are estimates based on published averages and will differ for your actual flight or vehicle.
Frequently Asked Questions
Is it better to fly or drive for the holidays?
For distances under about 1,500 km, driving with two or more people in an average car usually emits less CO₂ per person than flying economy. A solo driver is roughly level with a short-haul flight. For very long distances, a flight may be the only practical option.
Why does the calculator multiply by 1.9?
That is the radiative forcing index. Contrails, nitrogen oxides and induced cloud formation at altitude add warming beyond the CO₂ itself. Research by Lee et al. (2021) suggests aviation's non-CO₂ effects roughly double its total climate impact, so 1.9 is a commonly used estimate.
How much CO₂ does one economy flight produce?
A one-way 1,000 km economy flight produces about 255 kg of CO₂ per passenger, or roughly 480 kg of CO₂e once non-CO₂ effects are included. Long-haul flights produce less per kilometre but far more in total.
Does an electric car beat flying?
Almost always on a per-trip basis, yes. Even charged from an average grid, an EV usually emits well under half the CO₂ per mile of a petrol car, and sharing the ride divides it further. The exact figure depends on your local electricity mix.
How accurate are flight emissions calculators?
They are good for comparing options and ballpark offsetting, but not precise. Aircraft model, passenger load, headwinds and routing can each shift a real flight's emissions by 10–20% or more in either direction.
Try It Yourself
The holiday decision usually comes down to two numbers: how far you're going and how many of you are travelling. Enter both into the Flight Emissions Calculator, compare the result against your drive using the Fuel Cost Calculator or EV Charging Cost Calculator, and you'll have a real basis for the choice instead of a feeling.

Whichever way you get there, safe travels, and enjoy the dinner.